2022 Q2 Newsletter
The Rear View and the Front View
Turn out the lights, the party’s over. At least for now.
After a pretty lousy first quarter, bond and stock markets fared poorly again in Q2. The table below shows performance for various asset classes in the first half of 2022:
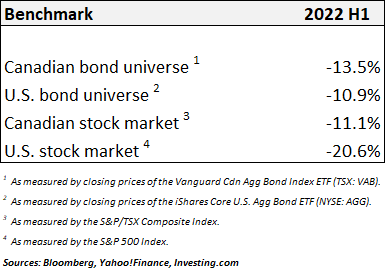
We recently read that the U.S. bond market had its worst start to a year since the U.S. Treasury was established in the 1700’s. We don’t plan to sift through 250 years of data to verify this, but we do know bond markets were terrible in H1, although thankfully not from experience as we’ve been zero weight in bonds this year. The U.S. stock market just had its worst first-half performance since 1970. There were few very places to hide in H1.
Speaking of hiding, cash continued to be the best-performing asset class in 2022, even though its value is being eroded 7-8% at today’s inflation rate. Hold cash and lose 7-8% of your purchasing power. Hold the U.S. bond or stock market and lose ~10-20% on top of another 7-8% in purchasing power. Not attractive in either case, but those who maintained significant cash levels can now re-establish positions at a material discount to just six months ago.
What is causing this sharp downtrend in capital markets? In previous newsletters, we’ve shared our view that that asset bubbles were inflating in multiple areas. The issue with bubbles, however, is they can persist for far longer than you think, and timing their “pop” is not easy.
Today, a confluence of factors is finally causing the “everything bubble” to burst. While we’ve seen massive fiscal and monetary stimulus over the 12 years since the post global financial crisis, the 2020-2021 pandemic period saw this stimulus go on steroids. Government payouts, combined with ULTRA-loose monetary policy, drove existing asset bubbles to astronomical heights across every asset class – stocks, bonds, real estate, cryptocurrencies, private equity, you name it.
Of course, the pandemic caused supply-side shocks as well, which have been further exacerbated by the war in the Ukraine and continued lockdowns in China. While the supply side is no doubt a factor, we maintain that fiscal and monetary largesse are the primary driver of what we’re seeing today. As one example, the U.S. Federal Reserve increased the money supply (M2) 42% during the pandemic. What else could they possibly expect but rampant inflation. The Fed clearly forgot the that “inflation is always and everywhere a monetary phenomenon.” Way too many dollars chasing too few goods/services is the bottom line.
Central banks globally are way behind the curve on inflation, and so they’re being forced into large and rapid interest rate increases to slow aggregate demand and quell inflation. Higher interest rates are causing asset bubbles to deflate. Stock and bond markets have responded most quickly, as they’re the most liquid and transparent, but know that laggards like real estate, private equity, and other less liquid categories are following suit.
In short, today’s debt levels are far too high, primarily because central banks kept monetary conditions too loose for far too long. It is estimated that the U.S. public holds over US$24-trillion in debt, up more than six-fold in the past 20 years. U.S. government debt today is ~120% of GDP; it was only 60% going into the 2008-2009 financial crisis. With debt at nosebleed levels, and interest rates rising quickly, the higher cost of servicing this debt is biting households, companies, and governments.
In our Q1 Newsletter, we told you our base case was that central bank tightening would cause a consumer-driven recession later in 2022 or 2023. We made this call well before recession became today’s favourite topic in the media. As it turns out, we may not have to even wait that long. The U.S. printed Q1 GDP of -1.5%, and the “real time” Atlanta Fed’s GDPNow tracker for Q2 is running at -2.1%. If Q2 prints negative, we’ll meet the technical definition of recession, though it would be relatively mild. Households still have some stimulus cash and labour markets remain tight, but we expect economic contraction to continue in the back half of this year.
Bear markets typically precede recessions, and this is what we’ve seen year to date in equities. Have we corrected sufficiently? The S&P 500 hit a pandemic low of around 2,200 in March 2020, and a post-pandemic peak of around 4,800 in January 2022. Sitting at around 3,800 today, we’ve retraced roughly half of distance between those two levels. What’s undeniable is we’ve done serious work to the downside, seeing the forward market P/E multiple of 21x shrink to about 16-17x – still high, but much closer to the longer term average. The next shoe to drop is likely the “E”, in other words we expect downward earnings revisions for the back half of the year as companies begin to report second-quarter earnings later in July.
Is a 20% retracement in the S&P 500 enough? The key determinant, in our opinion, is how high interest rates have to go. As long as inflation remains stubbornly high, we would expect central bankers will need to continue raising rates to maintain any semblance of credibility. This is likely to cause a rapid slowdown in economic activity and rapid increase in unemployment, which will swiftly catch their attention. In other words, central banks will keep raising until they break something.
As we’ve said before, we believe global central banks are dovish at their core. If forced to choose between quelling inflation and keeping the economy out of deep recession, we believe they’ll choose the latter. So does the bond market, as the forward curve is currently pricing in interest rate cuts in the latter half of 2023. Where will that leave us? If the Fed doesn’t go far enough on inflation to bring it under control, we may see a scenario where neither prong of their dual mandate – stable prices nor full employment – is satisfied. A protracted period of stagflation would likely ensue.
We don’t believe central banks have the tools or the resolve to fully address inflation. We’d therefore expect them to pivot to a dovish stance relatively quickly, leaving the inflation job undone and allowing inflation expectations to become further entrenched. Price stability is critical for an economy to function, and while the words of central bankers suggest they’ll be tough on inflation, it’s their future actions that will reveal their true colours.
To end this section on a slightly positive note, we have seen bond yields and commodity prices both come down in the latter half of June. If they can stabilize here or fall further, there is the potential for a short-term rally in the equity market.
Our Core Model Portfolios
Based on our cautious view at the time, our portfolio positioning coming into 2022 was defensive across our model portfolios, and it has remained so. Given market performance year to date and the benefit of hindsight, it’s easy to say that we weren’t defensive enough. That said, we’re happy we at least had our defence “on the field” at the start of 2022.
We have continued to hold cash in size in the first half of the year. As we mentioned earlier, it’s not ideal to have inflation erode the value of cash, but cash has performed far better than stocks or bonds.
We’ve continued to steer clear of the bond market, as we anticipated bond yields would go higher and therefore bonds prices would move lower. In the past few years, bond prices have lost their historically inverse relationship to stocks during periods of market stress. They simply have not served as an effective ballast to equities in times of duress.
We’ve held firm on our positions in infrastructure, real estate, and gold, as we believe they’ll hold their value better than most through an extended inflationary period. We remain overweight in utilities at this time, but we did exit core holdings in consumer staples toward the end of the quarter, as these had outperformed and we know all too well that nothing goes unscathed in a bear market.
As for our geographic allocations, you’ll recall from Q1 Newsletter that we’d built an overweight position in EMEA, with an emphasis on Western Europe. We had overweighted Europe vs. the U.S. on both valuation and expected easier monetary policy in the EU; however, recent events in European sovereign debt markets have us very concerned. The recent large spike in Italian government yields on the mere mention of higher interest rates in Europe, and the subsequent emergency meeting called by the ECB, are an early warning sign to us of another potential European sovereign debt crisis. While we continue to find European equity valuations attractive, Europe’s fundamental sovereign credit issue, together with a now antagonistic relationship with Russia on energy supply, has motivated us to exit our direct exposure to the region.
Our overweight in the Canadian equity market has outperformed year to date but has shown weakness in recent weeks. Financials, which make up about one-third of the Canadian market, have suffered on concerns that higher rates will bring large credit losses to bank loan books. Commodities, which also make up about one-third of the Canadian market, have been hit in recent weeks on investor concern about the impact of recession on commodity demand.
Emerging Market equities remain inexpensive in our view, particularly vs. the U.S. We slightly increased our EM exposure in the quarter, but strength in the USD kept us from adding more at this time. We continue to monitor EM carefully with a view to add if and when opportunity presents.