Looking Back and Looking Ahead
In Q3, the market narrative quickly shifted away from the hype around AI, and its levitating effect on “the Magnificent Seven” U.S. mega-cap stocks, to an intense focus on rising government bond yields, not just in the U.S. but across the developed world. U.S. 10-year Treasury yields touched 4.79% this week, marking a sixteen-year high going back to 2007 (prior to the GFC). Germany’s government bond yields recently reached a 13-year high, last seen during the European sovereign debt crisis in 2010. Global yields elsewhere are on the rise. In short, we are in a very different environment today than we were with low (or negative) bond yields from 2008 to 2022.
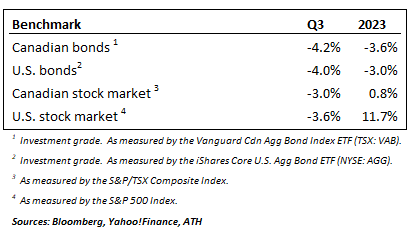
While bond prices fell due to higher yields, equity markets did not provide a counterbalance. A positive July and mixed August were followed by a weak September. Quarter and year-to-date returns are shown below:
The key question is…why are bond yields so high, and will these high yields persist or move even higher? Huge government deficits are driving an overwhelming supply of government bond issuance, which must offer enticing yields to compete for the attention of investors. Furthermore, bond investors today are demanding additional inflation compensation be reflected in yields they receive, as they witness the newfound power of labour manifesting in wage inflation, in addition to rising energy prices. Finally, and specific to U.S. federal bond issuance, the large buyers of the past – the Federal Reserve (via QE) plus Japan and China – are pulling back on purchases and/or selling Treasuries. We are hopeful, but not necessarily optimistic, that this sudden and rapid rise in yields won’t create unbearable stresses in the banking system or credit markets broadly.
Longer term, some suggest we could be at the beginning of a secular bear market in bonds. History does tell us that bull and bear markets in bonds span multiple decades before they reverse direction. The U.S., for example, saw a 40-year bull market in bonds (1982 to 2022), which was preceded by a 35-year bond bear market (1946-1981). The question is…was the 2020 peak in negative-yielding sovereign debt (~$18 trillion globally) the turning point for the bond market from bull to bear? Perhaps. Note that if U.S 10-year Treasury yields finished 2023 at today’s level, we’d have three consecutive years of negative total return in the benchmark 10-year Treasury – something that has never, ever occurred since the data started being collected in 1928. Of course, the bond market’s future path largely depends on central banks and their willingness to allow markets to freely discover price, rather than distorting the natural supply/demand balance as they have in the past through QE programs.
Economically, the U.S. has been remarkably resilient in the face of rapid central bank rate increases, though cracks are beginning to show in recent data on business bankruptcies, loan and credit card delinquencies/defaults, savings rates, etc. Furthermore, new headwinds have arrived in the past month or two, such as the ongoing UAW strike, a resumption in student loan payments after a long COVID-era holiday, and high energy prices. These headwinds, when combined with higher interest rates, will test U.S. economic resilience further.
They may also test the U.S. equity market, as its current valuation (~19x forward P/E on the S&P 500) relative to a mean of 15-16x presents valuation downside, particularly in a higher-rate environment. There’s been a chorus of market pundits calling September’s pullback (-3.7% on the TSX, -4.9% on the S&P 500) a “garden-variety” drawdown that can be attributed to seasonal weakness. Those same pundits seem to be anticipating a strong Q4. It’s true that we may see a relief rally in October, as a bad September is now in the rear view and U.S. shutdown politics are back on simmer for the next 45 days. It’s also true that we’re entering a seasonally stronger period for equity markets. That said, for markets to sustain strength through Q4 and beyond, a lot will have to go right.
The Canadian economy, in contrast, looks like it may already be in recession, as Q2 GDP in Canada was negative, and the StatCan data released last Friday showed July GDP was flat. High levels of household debt (vs. the U.S.) and greater sensitivity to interest rates (given Canada’s comparatively high proportion of variable rate debt/shorter-term fixed-rate mortgages) mean that Canadian consumers (representing ~60% of GDP) will continue to be challenged in the near-term, in our opinion. That said, at a ~12-13x forward P/E, the Canadian equity market is already reflecting a lot of this bad news.
Our Core Model Portfolios
We held zero bond exposure across all our model portfolios in 2022, but we began to build positions in investment-grade bonds in 2023. At the start of Q3, our weighted average bond duration was above above-market (100% investment grade); however, as our conviction rose that bond yields could move materially higher for longer, we reduced our longer-duration (i.e. most yield-sensitive) bond holdings at various points in the quarter and finished Q3 with bond portfolio duration at ~5 years in our core model portfolios. This did help our model portfolio performance, as bond yields ascended ~50 basis points in September alone. The rapid ascent in yields, however, also put downward pressure on our income-oriented dividend-growth model portfolio.
In terms of our growth-focused equity exposure, we’ve been “reluctant bulls” in 2023, and have maintained discipline by periodically trimming our (outperforming) U.S. equity positions, as that market has outperformed most in 2023, after a tough 2022. The bulk of U.S. market outperformance has come from the Magnificent Seven, in fact the other 493 components of the S&P 500, as a group, are essentially unchanged over the past 24 months. As we hold significant equity index positions in many of our model portfolios, we’ve thankfully participated in the outperformance of the aforementioned Magnificent Seven.
As we end the quarter, our growth-focused model portfolios continue to reflect our preference for equity markets with better valuations, such as Canada, Japan, and Emerging Markets (with P/E multiples in the 10-13x range). We also continue to hold a small weighting in gold streaming and royalty assets in our models. Until recently, gold prices had held in relatively well in the face of rapidly rising real interest rates and a strengthening U.S. dollar. We remain comfortable with our current exposure to, and weighting, in gold.
Finally, we continue to hold the highest portfolio weighting in interest-bearing cash equivalents in our Firm’s history. These holdings (high-interest savings ETFs and short-term government T-bills) deliver a weighted average interest rate of ~5.3% in our model portfolios, with full capital preservation. With inflation lower than 5.3%, our clients are enjoying positive real cash rates of return on a large proportion of their portfolios – a nice place to wait while ATH gradually deploys capital to a growing set of opportunities.